Discovery & KPI mapping
Interviews with leadership to find the handful of numbers that actually change a decision — planned vs actual catch, per-vessel performance, production yield, quota utilization by species and zone.
Case study · Operations Analytics · Mobile
How we used rapid prototyping and ruthless MVP scoping to ship a real-time fleet analytics app on iOS and Android — and trimmed the development budget by roughly 20% by validating every screen in a clickable prototype before a line of production code was written. Built for decision-makers, deliverable to teams across the US & EU.

The Lucky Shrimp leadership team ran a multi-vessel operation on Excel. Consolidating catch and production figures across the fleet took roughly two weeks, and by the time a unified picture existed, the conditions that picture described had already moved on. Decision-makers wanted what every modern operations team in the US & EU wants: a real-time dashboard they can open on a phone and read in thirty seconds. The risk in a build like this is over-scoping — data-heavy apps invite endless "while we are at it" features, and that is exactly where mobile budgets bleed. So the engagement opened not with code but with a prototype. We built Lucky Shrimp from a single, validated insight: the leadership user does not need every chart, they need the four or five numbers that change a decision. The product we shipped at yusmpgroup.ru is a single-role executive analytics app on iOS and Android, and the way we got there — prototype first, scope hard, build once — is the reason the development budget came in about 20% lower than a conventional build-it-and-see approach would have cost across the US and EU stakeholders involved. The build sits inside our mobile app development practice.
A snapshot of what the prototype-first approach delivered for Lucky Shrimp across iOS, Android, and a shared analytics backend.
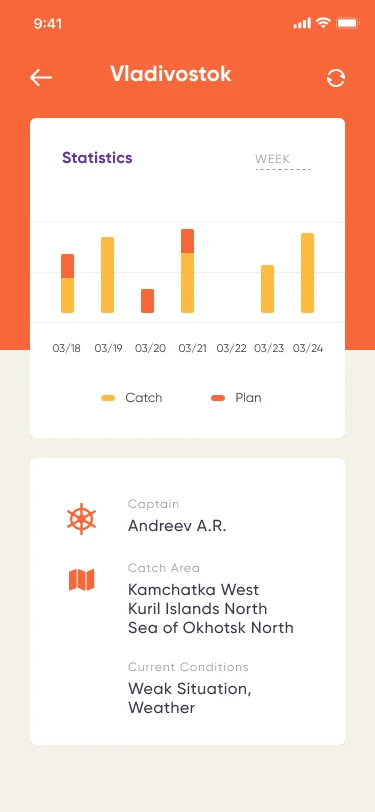
The cheapest place to make a mistake on a mobile app is in a design tool; the most expensive is in a shipped iOS and Android build. That single trade-off is why we opened Lucky Shrimp with a clickable prototype rather than a sprint plan. Stakeholders tapped through a high-fidelity model of every screen — the home dashboard, the vessel drill-down, the quota views — and the screens that did not earn their place were cut before any engineer touched them. Prototyping is not decoration; it is a cost-control instrument. Every screen that survived the prototype was already validated, so the team built once instead of building, demoing, discovering the gap, and rebuilding.
This is also where the roughly 20% budget reduction comes from, and it is worth being precise about the mechanism. We did not write faster code. We wrote less code, because the prototype removed the redundant features, the wrong data hierarchies, and the speculative screens that a conventional build would have implemented, demoed, and then thrown away. A prototype turns the most expensive class of change — "actually, we need this completely different" — into a five-minute edit in the design file. That is the lever, and it is available to any team in the US & EU willing to spend a fraction of the budget up front.
| Dimension | Prototype-first (Lucky Shrimp) | Build-first / demo-and-fix | No design — straight to code |
|---|---|---|---|
| Where mistakes get caught | In the design tool — minutes to fix | After a sprint ships — days to fix | In production / store review — weeks to fix |
| Typical rework cost | Lowest — change before code exists | Moderate — re-implement shipped screens | Highest — refactor a live codebase |
| Scope discipline | Forced — features justified before build | Weak — features added mid-flight | None — scope discovered in code |
| Stakeholder sign-off | Early, on a tappable model | Late, on running software | After launch, on the live app |
| Upfront cost | Small — a fraction of the build | None — but deferred to rework | None — paid back with interest |
| Net effect on budget | ~20% lower on this engagement | Baseline | Often over baseline |
| Fit for data-heavy apps | Strong — data hierarchy validated early | Risky — chart sprawl emerges late | Poor — analytics needs structure first |
Process references: Nielsen Norman Group on prototype fidelity, Apple Human Interface Guidelines, Android design guidance.
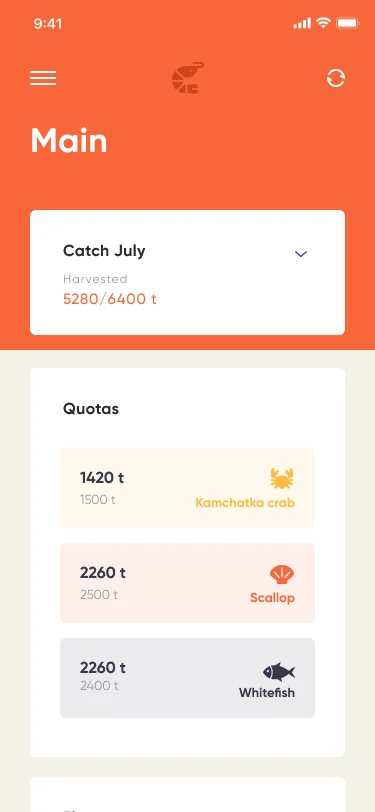
The iOS client is built natively in Swift because a data-dense executive dashboard lives and dies on chart smoothness and drill-down responsiveness. The home screen leads with the one number that matters — planned versus actual catch as a single donut and a short stack of KPI tiles — and a tap takes the user one level down into a specific vessel, where weekly catch-versus-plan bars, the captain, the catch area, and current conditions sit on one calm screen. We followed Apple's Human Interface Guidelines closely so the app feels like it belongs on the device of a busy decision-maker who opens it for a thirty-second status check, not a reporting session.
Native rendering matters here precisely because the content is numbers. A laggy chart or a janky drill-down erodes trust in the data itself, and trust is the entire product. Keeping the iOS surface native let us tune scroll performance, animate the donut as data refreshes, and keep the per-vessel view instant — the experience a US or EU executive expects from a tool they will actually open every morning. The iOS surface is delivered as part of our iOS and Android engineering practice.
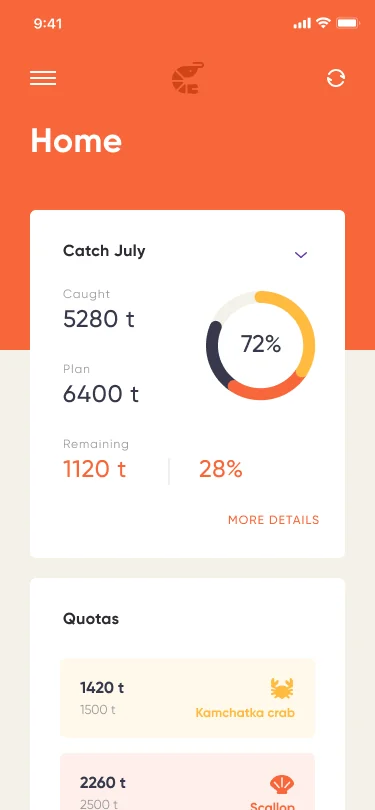
The Android client is written in Kotlin and renders the same validated screen set the prototype locked in: the harvested-versus-plan summary, the quota list broken down by species and fishing zone, and the production yield view. Building both platforms off one prototype meant the iOS and Android teams worked from an identical, signed-off blueprint — no platform drifted into its own interpretation of the dashboard, and no feature appeared on one store and not the other. That discipline is a direct dividend of prototyping: the cut line was drawn once, in the design file, and both clients respected it.
The MVP scope itself was the other half of the budget story. Every candidate feature was ranked against one question — does it change a decision — and quota tracking, planned-versus-actual catch, per-vessel analytics, and production yield made the cut while a long tail of "nice to have" reports did not. Scoping hard is uncomfortable in the room and invaluable in the budget, and it is the same discipline we bring to every custom software development engagement for clients across the US & EU.
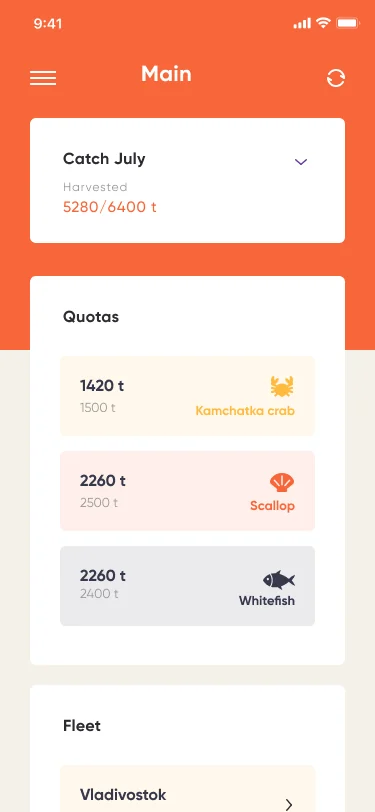
Behind both clients sits a PHP backend that does the unglamorous work the whole product depends on: pulling figures from multiple vessels, reconciling them against the business plan, computing the KPI math once, and handing clean, aggregated series to iOS and Android over a single API. Putting the aggregation logic and quota rules in one backend rather than duplicating them per platform is why the two apps stay in lockstep — a change to how a quota is calculated ships to both clients from one place. The fleet view is where this pays off: a real-time list of vessels, each a tap away from its own analytics, assembled server-side so the phones stay thin and fast.
Even for an internal operations tool, we treat the data plane as if it will face an outside reviewer. Access is scoped to the single executive role the MVP defined, transport is encrypted, and the aggregation layer reports rolled-up business figures rather than exposing raw per-record feeds wholesale — a posture that maps cleanly onto GDPR expectations in the European Union and CCPA / CPRA expectations in California and the broader United States, should the client ever extend the app to teams under those regimes. The control plane and aggregation infrastructure are part of our cloud & DevOps practice.
Compliance posture: GDPR-aligned · ISO 27001 ready · SOC 2 Type II in progress · HIPAA-capable · CCPA-acknowledged.
A five-phase build that took Lucky Shrimp from a pile of spreadsheets to a real-time analytics app on iOS and Android — prototype first, scope hard, build once.
Interviews with leadership to find the handful of numbers that actually change a decision — planned vs actual catch, per-vessel performance, production yield, quota utilization by species and zone.
A high-fidelity, tappable model of every screen. Stakeholders validate the data hierarchy and cut speculative features before any production code exists — the core of the ~20% budget saving.
Every feature ranked against decision-impact. The single-role executive dashboard makes the cut; the long tail of nice-to-have reports is deferred to a documented roadmap.
Swift iOS client and Kotlin Android client built off one signed-off blueprint, both reading from a shared PHP aggregation backend so the platforms never drift.
Store submission, real-time data wiring, and a backlog primed for the deferred features — the extensible architecture turns the next phase into iteration, not a second project.
The most important thing an MVP can do after it ships is not become a dead end, and Lucky Shrimp was architected so it does not. Because the prototype validated the data hierarchy before engineering started, the screens map directly onto a backend whose aggregation layer was built to absorb new inputs — additional vessels, new data sources, new KPI views — without disturbing the clients. The single executive role the MVP defined is the first of several the architecture anticipates; adding a fleet-manager role or a production-lead role is a matter of new permissions and new views over the same aggregated data, not a new product. This is the difference between a throwaway demo and a genuine first version: the demo proves a point and is discarded, while the MVP proves the point and becomes the foundation. For the Lucky Shrimp team that means the next round of work — deeper analytics, multi-role access, more fleet integrations — is iteration on a clean codebase, and the prototype-first discipline that saved roughly 20% on the first build keeps paying out as the product grows for the US & EU stakeholders behind it.
Lucky Shrimp is an English-language operations app, and the way we build and run it is designed for distributed decision-makers across the US & EU. The same single codebase per platform serves users without a regional fork: an executive in California, New York, Texas, Florida, or Washington reads the same dashboard as a counterpart in the Netherlands, Germany, France, Ireland, or Sweden. Where the app touches personal or operational data, the architecture is built to honor the regulatory patchwork rather than fight it — data-handling practices align with GDPR for users in the European Union and with the US state-privacy landscape: CCPA / CPRA (California), VCDPA (Virginia), CPA (Colorado), CTDPA (Connecticut), UCPA (Utah), TDPSA (Texas), and Oregon CPA. Because the MVP scope kept the data surface deliberately narrow — aggregated business figures for one role — regional compliance reduces to honest disclosure and access control rather than per-jurisdiction data segregation.
The engineering team behind the build sits across CET and runs a CET workday with East-Coast US overlap (9 AM–1 PM ET) for stand-ups, demos, and review — the window that lets a US product owner and an EU engineering team share four hours of live overlap every day, citing GDPR obligations and California CCPA obligations directly where the app is extended to regulated user groups. The result is a prototyping-and-MVP capability we can apply to data-heavy mobile products for teams anywhere in the US & EU.
The active custom software development roadmap for Lucky Shrimp builds on the deferred MVP backlog: multi-role access beyond the single executive view, deeper per-vessel and per-species analytics, configurable KPI dashboards, and additional data-source integrations as the fleet's telemetry matures. Because the architecture was kept extensible from the prototype forward, each of these is a feature increment rather than a rebuild. Infrastructure plans include tighter real-time pipelines and observability scaffolded into the cloud & DevOps roadmap, so the next phase scales the same clean foundation the first build established.
If you are scoping a data-heavy mobile app, a real-time dashboard, or any MVP where the budget has to be respected and the rework has to be designed out, we have shipped this prototype-first playbook end-to-end for the US & EU and can apply it to your build. The Lucky Shrimp case detail lives at yusmpgroup.ru (iOS and Android), and the engineering team behind it sits inside YuSMP Group. We work fixed-price for well-scoped MVPs and on dedicated development teams for ongoing delivery, with a CET workday and a guaranteed East-Coast US overlap (9 AM–1 PM ET) window for stand-ups, demos, and review.
A clickable prototype turns assumptions into a thing stakeholders can tap before any production code exists. On Lucky Shrimp, prototyping let the client cut the development budget by roughly 20% because the most expensive mistakes — wrong screens, redundant features, unclear data hierarchies — were caught and removed in a design tool rather than in a shipped iOS and Android build. Every screen that survived the prototype was already validated, so the engineering team built once instead of building, demoing, and rebuilding.
An MVP is the smallest version of a product that delivers the core value users actually need. We scope one by ranking every candidate feature against a single question — does it move the primary metric the client cares about. For Lucky Shrimp that metric was decision speed, so the MVP kept planned-versus-actual catch, per-vessel drill-down, production yield, and quota tracking, and deferred everything else. Ruthless scoping is what kept the build inside budget for the US and EU stakeholders involved.
A clickable prototype for a focused, single-role analytics app typically takes one to three weeks, depending on how many data views need validating. The MVP build that follows — native iOS and Android clients plus an aggregation backend — typically runs eight to fourteen weeks for a comparable scope. Lucky Shrimp itself ran an active build of roughly two months because the prototype removed rework before engineering started, which is the entire point of prototyping first.
Native clients in Kotlin and Swift give a data-dense dashboard the smoothest charts, the most responsive drill-downs, and the cleanest fit with each platform's design language — which matters when busy executives in the US and EU open the app for a thirty-second status check. We pair native clients with a shared PHP backend so the aggregation logic, KPI math, and quota rules live in one place and both apps stay in lockstep across releases.
Yes — that is the design intent. The Lucky Shrimp prototype was structured so the validated screens map directly onto a backend whose aggregation layer can absorb new data sources, new roles, and new KPI views without a rewrite. Because the MVP shipped on a clean, extensible architecture rather than a throwaway demo, adding multi-role access, deeper analytics, or new fleet integrations becomes a configuration and feature exercise, not a second project.
Related cases
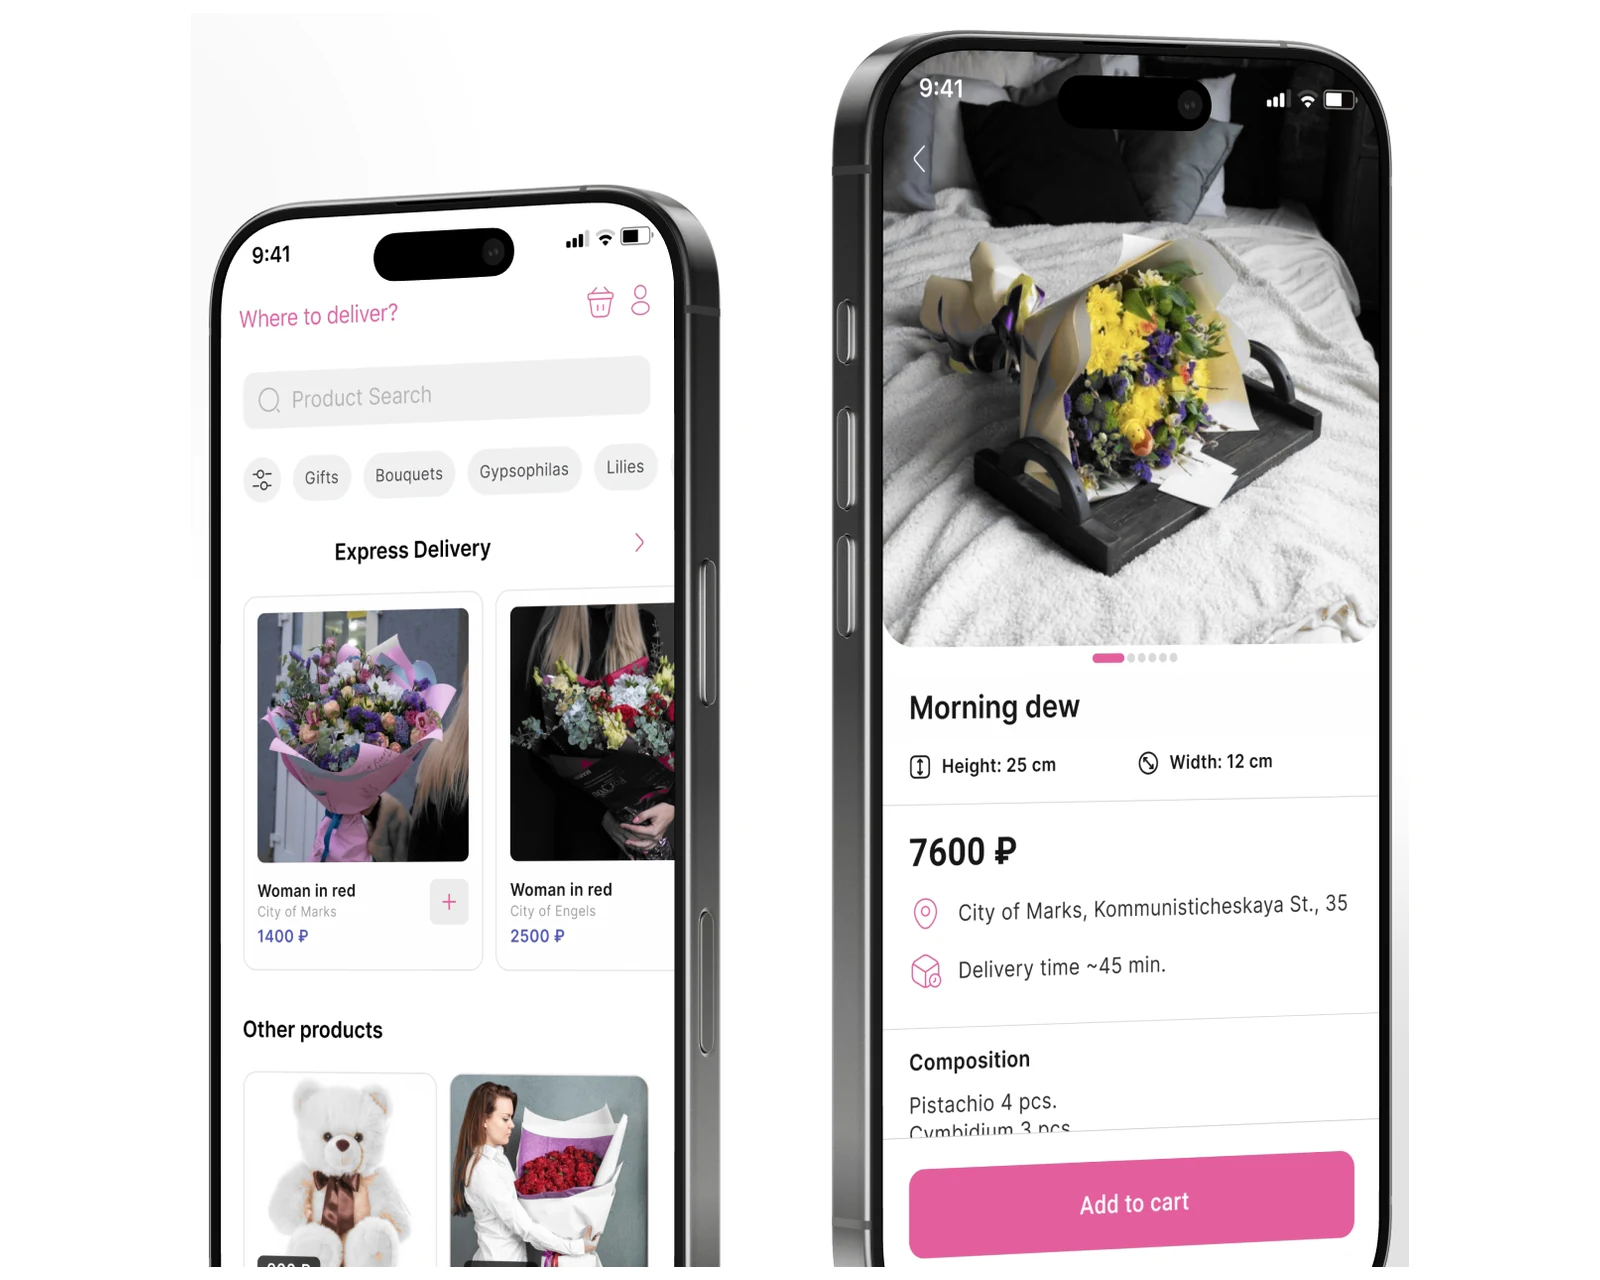
Real-time courier and delivery operations on mobile — routing, dispatch, and an ops dashboard for teams across US & EU.
View case →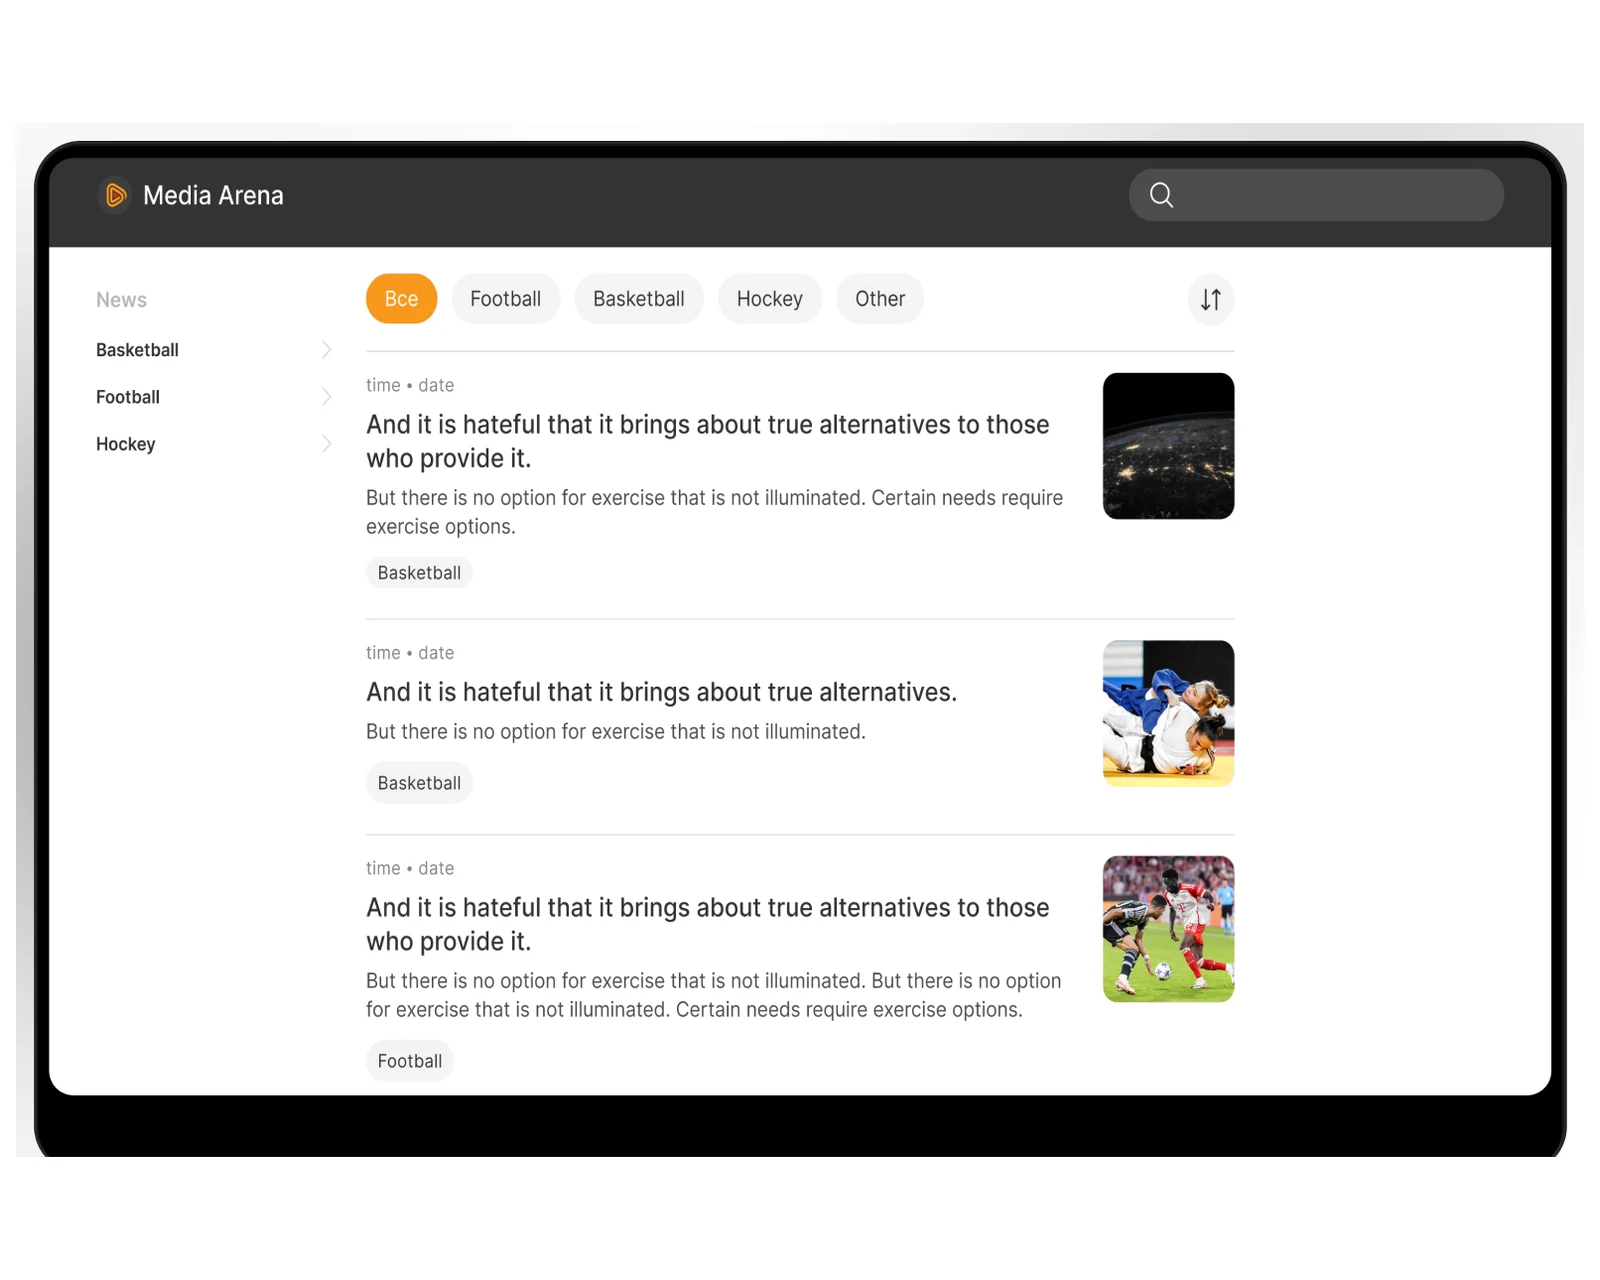
Live feeds, athlete profiles, and a stats dashboard — a data-dense mobile experience built for fast reads.
View case →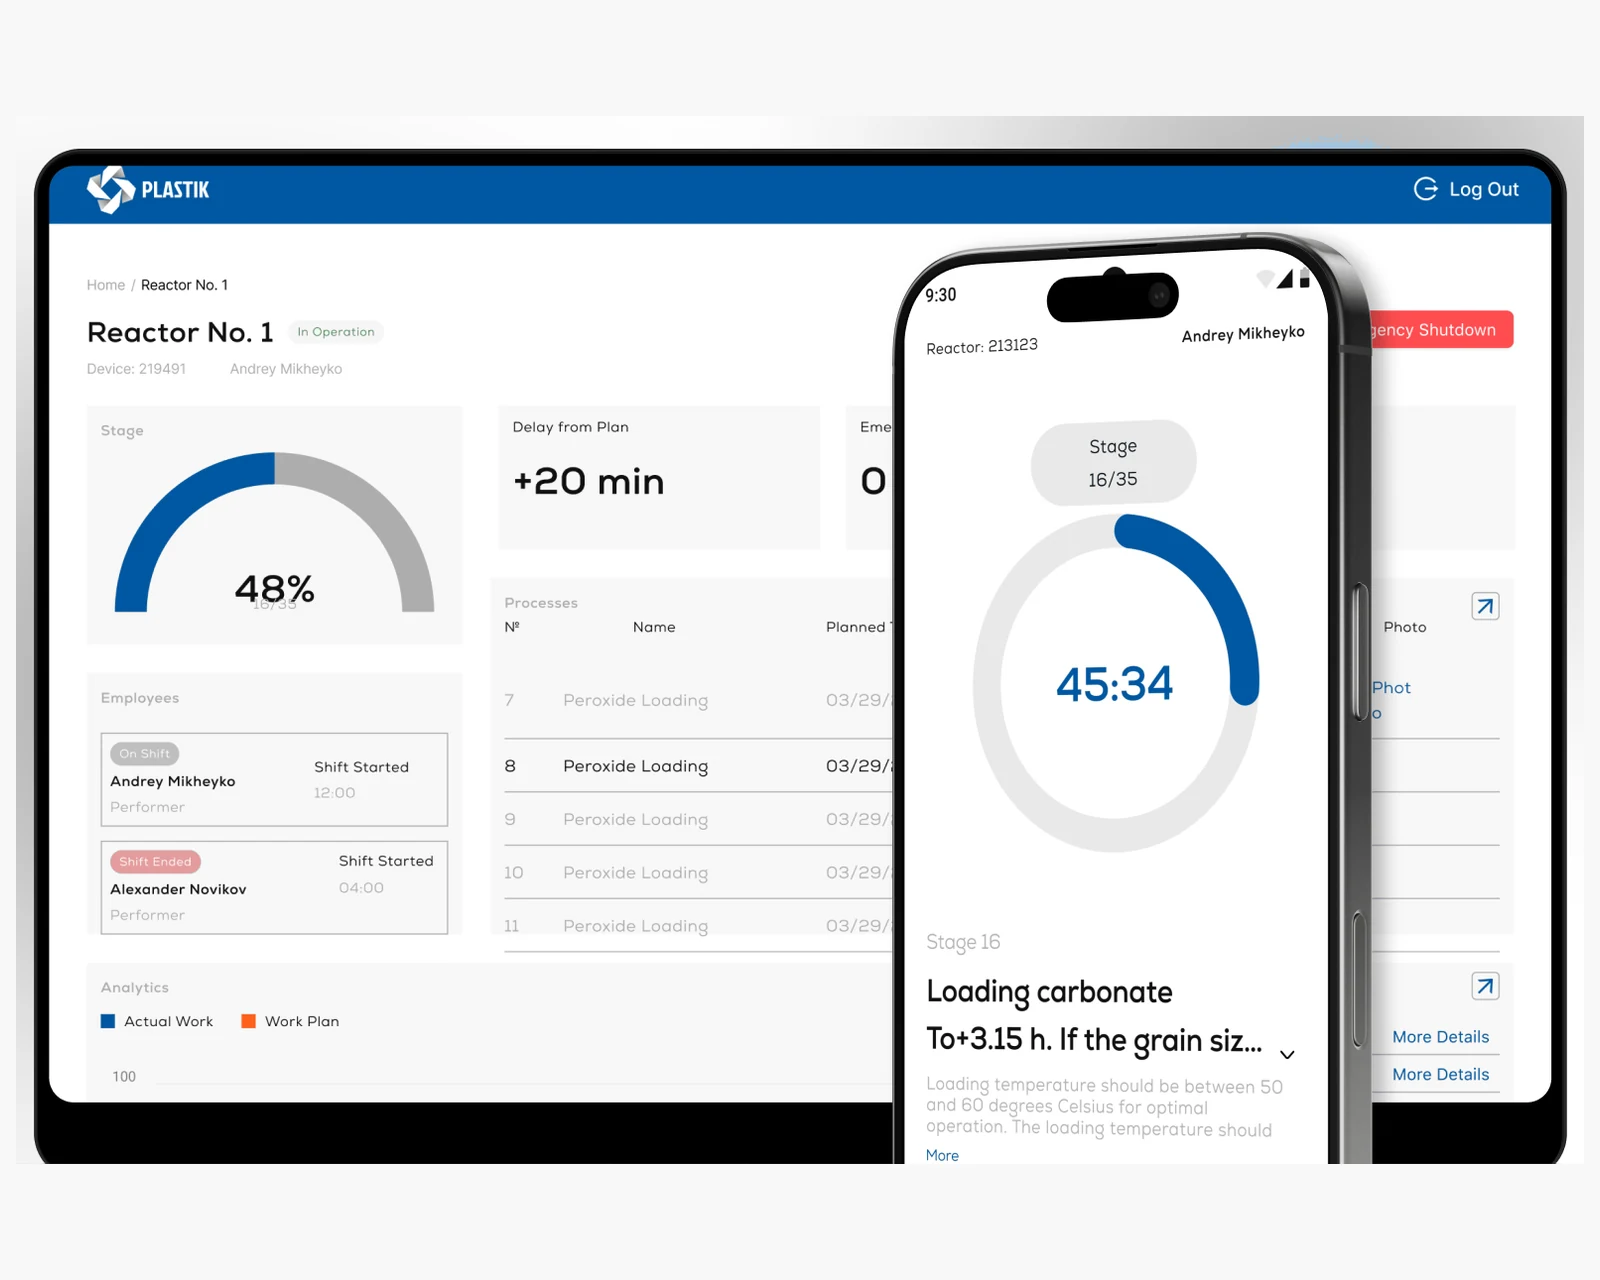
Field-audit workflows and an ops dashboard — structured data capture turned into reportable analytics.
View case →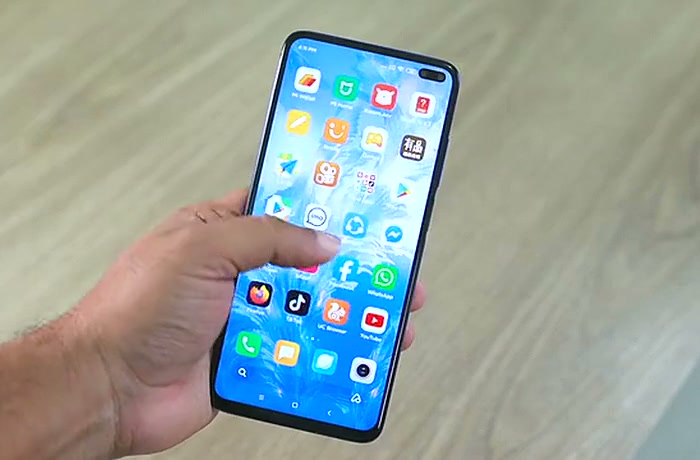
Native iOS, Android, and cross-platform apps with store-ready release pipelines.
Explore mobile app development →
Custom platforms engineered to your business model, scaling cleanly from MVP to millions of users.
Explore custom software development →
Resilient cloud infrastructure, CI/CD pipelines, and observability for data-heavy products.
Explore cloud & DevOps →Share a few details and a senior consultant will reply within one business day.