Dashboard sprawl and governance
Unmanaged Grafana instances accumulate hundreds of ad-hoc dashboards with inconsistent naming, broken panels and no ownership. Finding the authoritative view during an incident wastes critical minutes.
Grafana ties metrics, logs and distributed traces into a single pane of glass — eliminating context-switching between Datadog, Splunk and CloudWatch during an incident. We design and deploy production Grafana environments with the full LGTM stack (Loki, Grafana, Tempo, Mimir), dashboards-as-code provisioning, SSO and RBAC for US and EU engineering teams who need operational visibility without vendor lock-in.
Grafana ties metrics, logs and distributed traces into a single pane of glass — eliminating context-switching between Datadog, Splunk and CloudWatch during an incident. We design and deploy production Grafana environments with the full LGTM stack (Loki, Grafana, Tempo, Mimir), dashboards-as-code provisioning, SSO and RBAC for US and EU engineering teams who need operational visibility without vendor lock-in.
Unmanaged Grafana instances accumulate hundreds of ad-hoc dashboards with inconsistent naming, broken panels and no ownership. Finding the authoritative view during an incident wastes critical minutes.
Broad data-source permissions expose sensitive infrastructure metrics to the wrong teams. Without folder-level RBAC and per-data-source service accounts, any Grafana user can query production databases.
Teams running both Grafana Alerting and Prometheus Alertmanager end up with duplicated, conflicting alert rules. Routing logic diverges, notifications are missed and on-call engineers receive contradictory pages.
Manually created dashboards cannot be version-controlled, reviewed or promoted across environments. Organisations that rely on UI-only editing cannot reproduce their observability setup after a cluster migration.
Without a correlated LGTM stack, engineers switch between separate Prometheus, Loki and Jaeger UIs during an incident — losing time re-querying the same time window across disconnected tools.
Connecting Grafana to corporate identity providers (Okta, Azure AD, Google Workspace) and enforcing team-level folder isolation requires careful SAML/OIDC configuration that is easy to misconfigure silently.
All dashboards defined in version-controlled JSON/YAML via Grafana provisioning — templated, peer-reviewed and promoted through dev/staging/production with zero manual UI clicks.
Grafana + Loki + Tempo + Mimir deployed as a self-hosted or Grafana Cloud stack — one unified query surface for logs, distributed traces and long-retention metrics without per-metric cardinality limits.
SAML/OIDC integration with Okta, Azure AD or Google Workspace; folder-level RBAC mapping IdP groups to Grafana roles; per-data-source service accounts with read-only least-privilege access.
Grafana Explore links and exemplar annotations correlate a Loki log spike with a Mimir metric anomaly and the corresponding Tempo trace — root cause in one click rather than three tool switches.
Unified alert rules in Grafana Alerting replace dual Alertmanager routing; Grafana OnCall manages escalation schedules, silences and incident timelines — with Slack, PagerDuty and Mattermost integrations.
Single-pane dashboards combining Prometheus, Elasticsearch, PostgreSQL, CloudWatch and custom API data sources — query federation without data duplication or ETL pipelines.
GDPR-aligned RBAC · SOC 2 audit logging · NIS2 incident visibility · DORA operational resilience
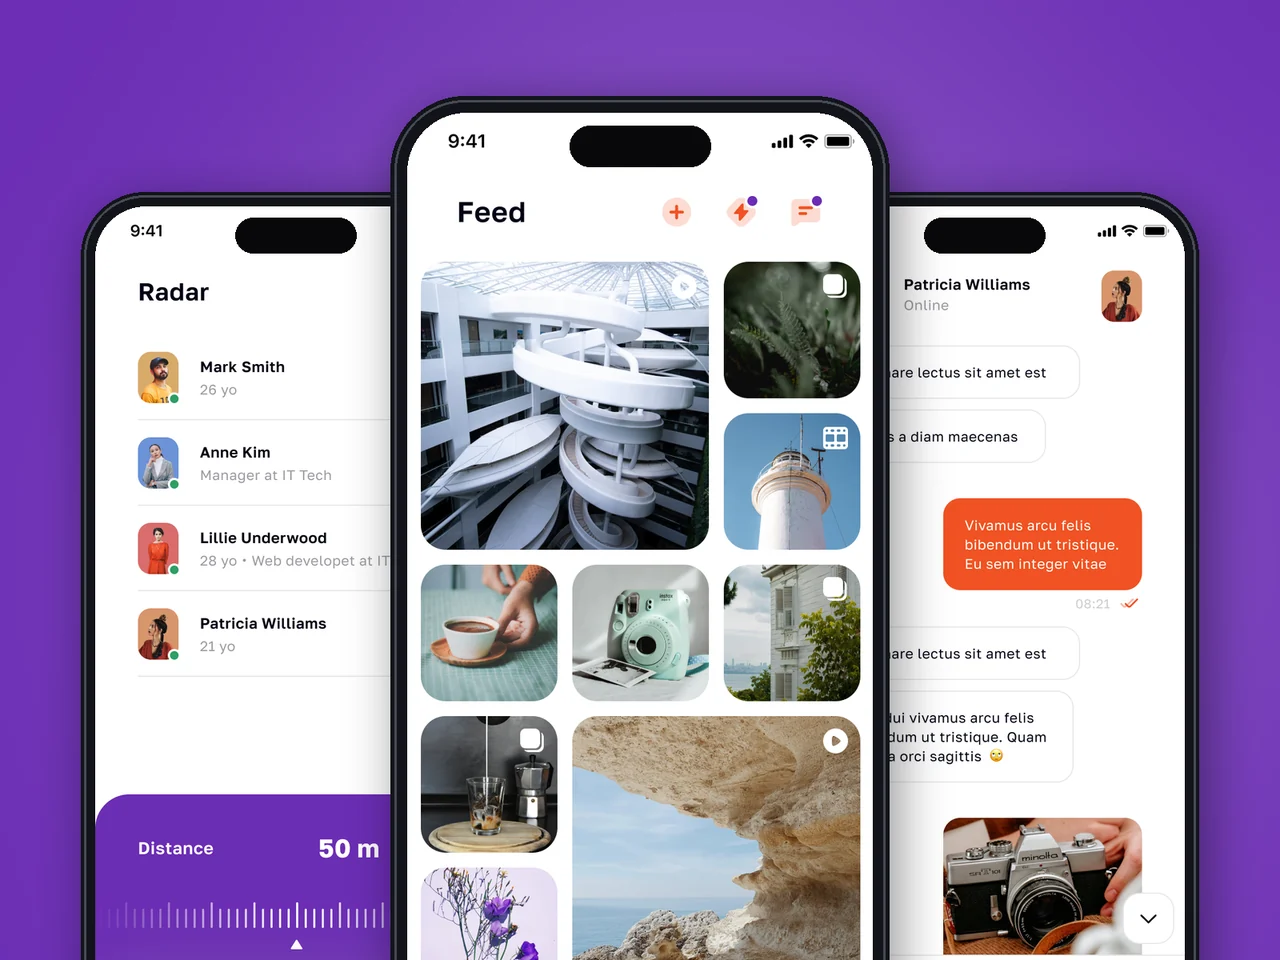
Production social platform — App Store + Google Play, live across the US and EU — with geo Radar, encrypted messaging and a virtual economy.
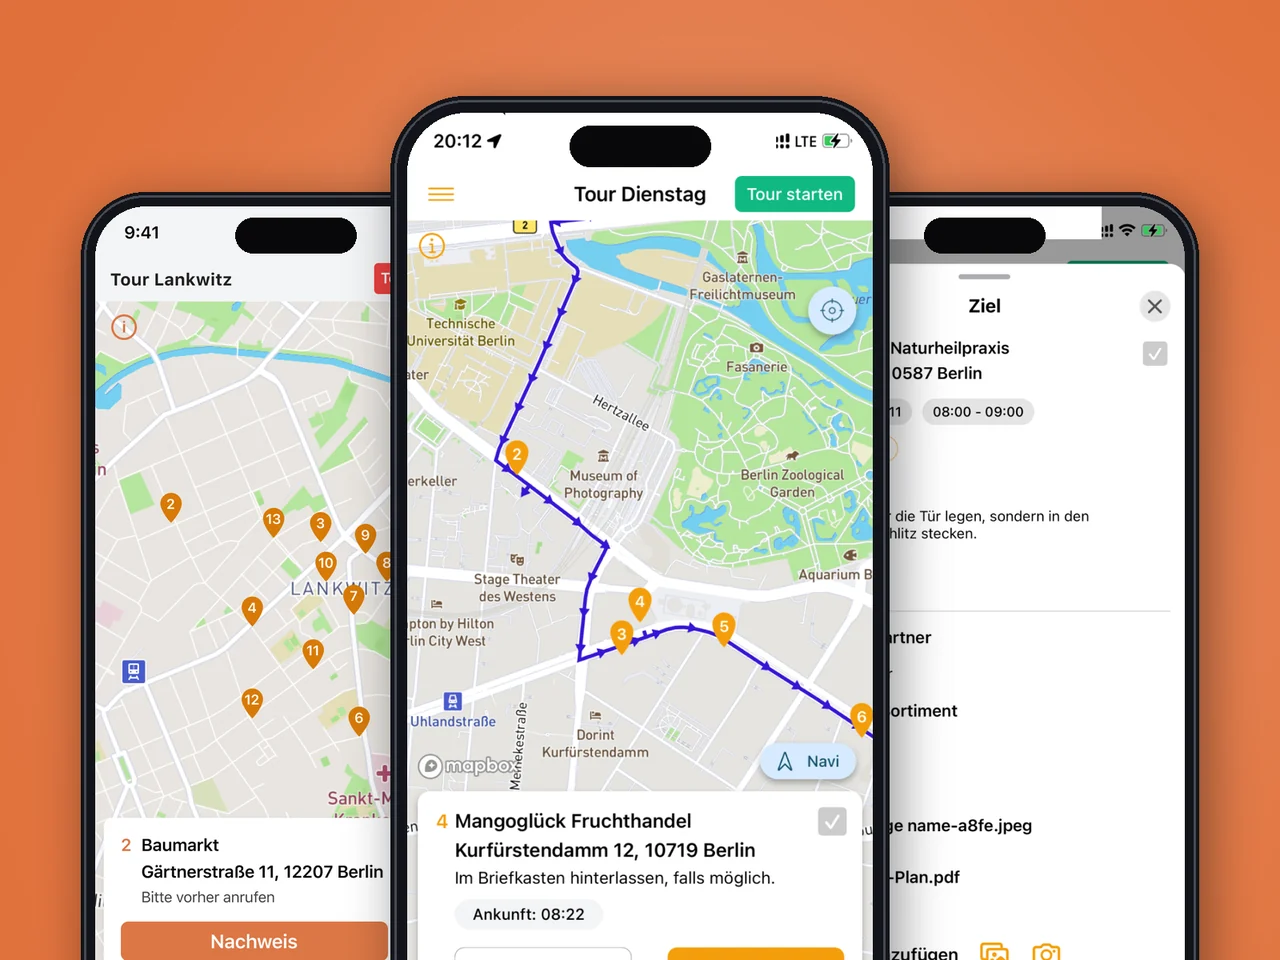
Android + iOS refactor and rebuild for a German last-mile logistics operator — multi-point route planning, real-time driver tracking and in-app invoicing live in the EU.
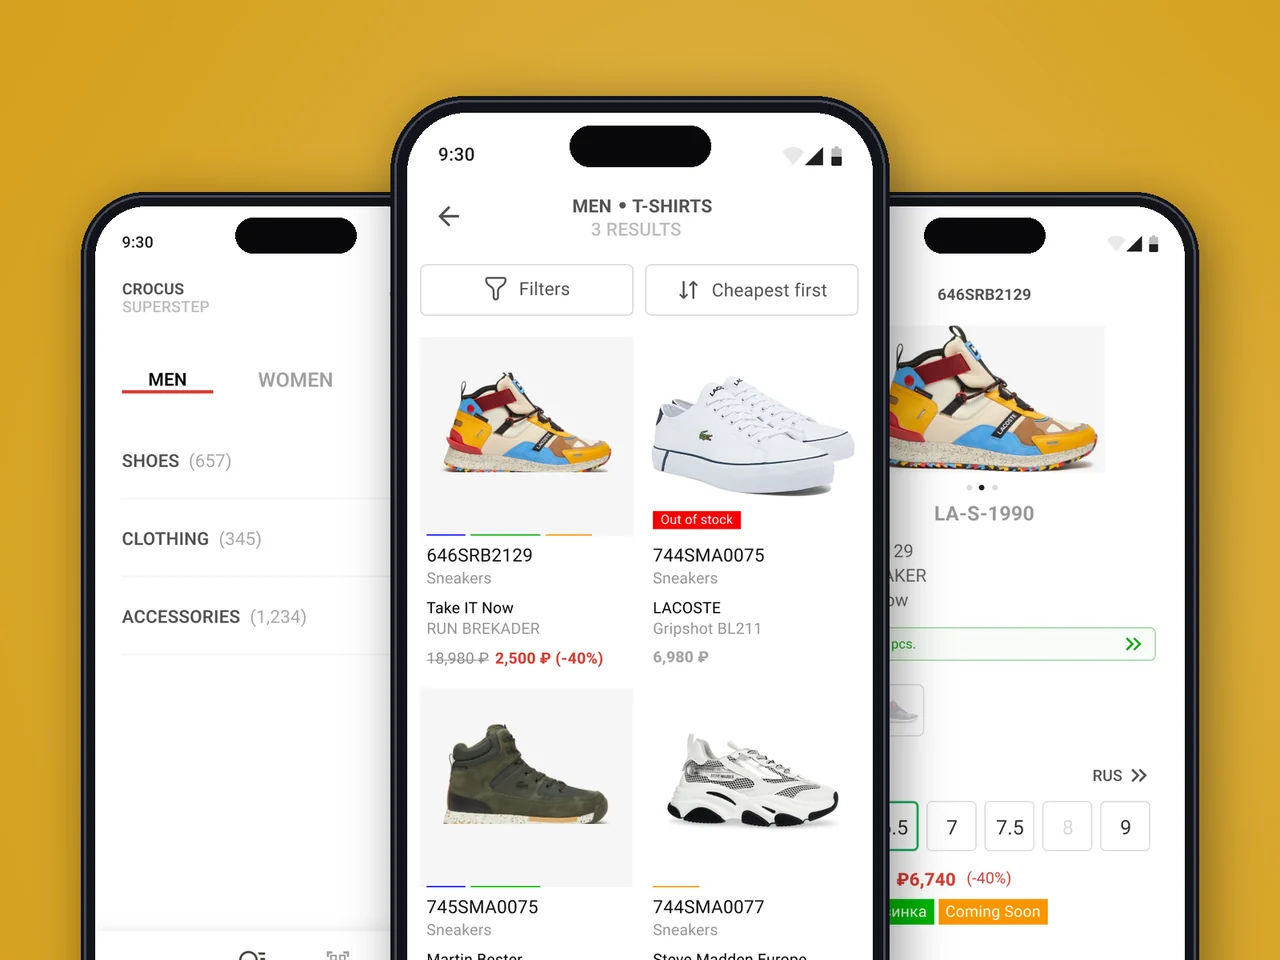
Retail POS companion app for a multi-brand boutique chain — ElasticSearch cross-store inventory search, 1C-system integration.
The legacy Android app had years of accumulated debt and no iOS counterpart. YuSMP refactored the existing code, shipped the iOS version, and added live driver tracking and in-app invoicing — all without stopping daily operations for our drivers.
Building a social platform from scratch is high-stakes work. YuSMP delivered the interest feed, geo Radar, Stories, and virtual coins economy on schedule, with a codebase our in-house team picked up on day one of handoff.
Our consultants were losing 15 minutes per customer on manual inventory checks. YuSMP built native apps backed by ElasticSearch, wired to our 1C system in real time. Time-per-customer dropped 40% across all locations within a week of launch.
A loan decision engine that takes ten times less time to approve does not happen by accident. YuSMP built the scoring pipeline, integration with credit bureaus, and a back-office that our underwriters actually enjoy using. Approval turnaround went from two days to under four hours.
1 / 4
The full LGTM stack is open-source and self-hostable. We design your observability platform so you own the data, the dashboards and the alerting logic — not a SaaS vendor's pricing model.
Version-controlled, provisioned dashboards mean a new engineer can rebuild your entire observability environment from a Git repository. There are no undocumented UI-only customisations.
Correlated logs, metrics and traces in one UI cut mean time to root cause. Our Grafana setups are designed around the workflows your on-call team uses under pressure, not demo aesthetics.
FAQ
Datadog is a fully managed SaaS with a broad feature surface and usage-based pricing that scales steeply at high cardinality. Grafana (self-hosted or Grafana Cloud) gives you control over data residency, pricing and the full LGTM stack. We recommend Grafana for teams with GDPR/data-sovereignty requirements, high metric cardinality budgets, or a preference for open-source tooling — and Datadog when a managed, zero-ops platform justifies the cost.
LGTM stands for Loki (log aggregation), Grafana (visualisation and alerting), Tempo (distributed tracing) and Mimir (long-retention scalable metrics, a drop-in Prometheus replacement). Together they form a self-hosted observability platform that covers all three telemetry pillars — logs, metrics and traces — under a single Grafana UI without requiring separate specialist tools for each signal type.
Grafana's provisioning system reads dashboard JSON and data-source YAML from files on disk (or a Git repository via tools such as Grafonnet or Terraform). This means every dashboard is version-controlled, code-reviewed and reproducible across environments. Changes are deployed through CI/CD rather than manual UI edits, giving you a full audit trail and the ability to roll back a bad dashboard change in seconds.
Prometheus scrapes metrics from your services and stores them locally; Grafana queries Prometheus (or Mimir, a scalable Prometheus-compatible backend) via PromQL and renders the results as panels. Grafana does not replace Prometheus — it is the visualisation and alerting layer on top. In a typical LGTM setup, Mimir replaces the local Prometheus storage for long retention and horizontal scalability, while Prometheus agents continue scraping at the edge.
We configure Grafana's SAML or OIDC integration against your identity provider (Okta, Azure AD, Google Workspace). IdP groups are mapped to Grafana organisation roles and folder permissions. Each team sees only the dashboards and data sources assigned to their folder. In multi-tenant deployments, Grafana organisations or Grafana Enterprise's RBAC provide hard tenant boundaries with separate data-source credentials per tenant.
Loki indexes only labels (not full-text), making it far cheaper to operate at scale — it stores compressed log chunks in object storage (S3, GCS). Elasticsearch indexes every field, enabling powerful full-text search but at significantly higher storage and compute cost. Choose Loki when you control your log structure and query primarily by labels (service, environment, level); choose Elasticsearch when you need arbitrary full-text search across unstructured legacy logs or require Kibana's ecosystem.
Self-hosted Grafana (OSS or Enterprise) gives you full control over data residency, retention, cost and configuration — the right choice for strict GDPR/data-sovereignty requirements or high-volume metrics where Grafana Cloud pricing becomes significant. Grafana Cloud removes operational overhead and provides managed alerting, synthetic monitoring and frontend observability out of the box. We help teams evaluate the build-vs-buy tradeoff and can set up or migrate either option.
Tell us where you want to be in twelve months. We’ll come back with a plan to get you there.
Response within 1 business day. NDA on request.
Share a few details and a senior consultant will reply within one business day.
Email: sales@yusmpgroup.com
Phone: +374 44 871 811
Offices: KAMAR Business Center, Vazgen Sargsyan St. 2, Yerevan, Armenia · Remote — East-Coast US overlap (9 AM–1 PM ET)